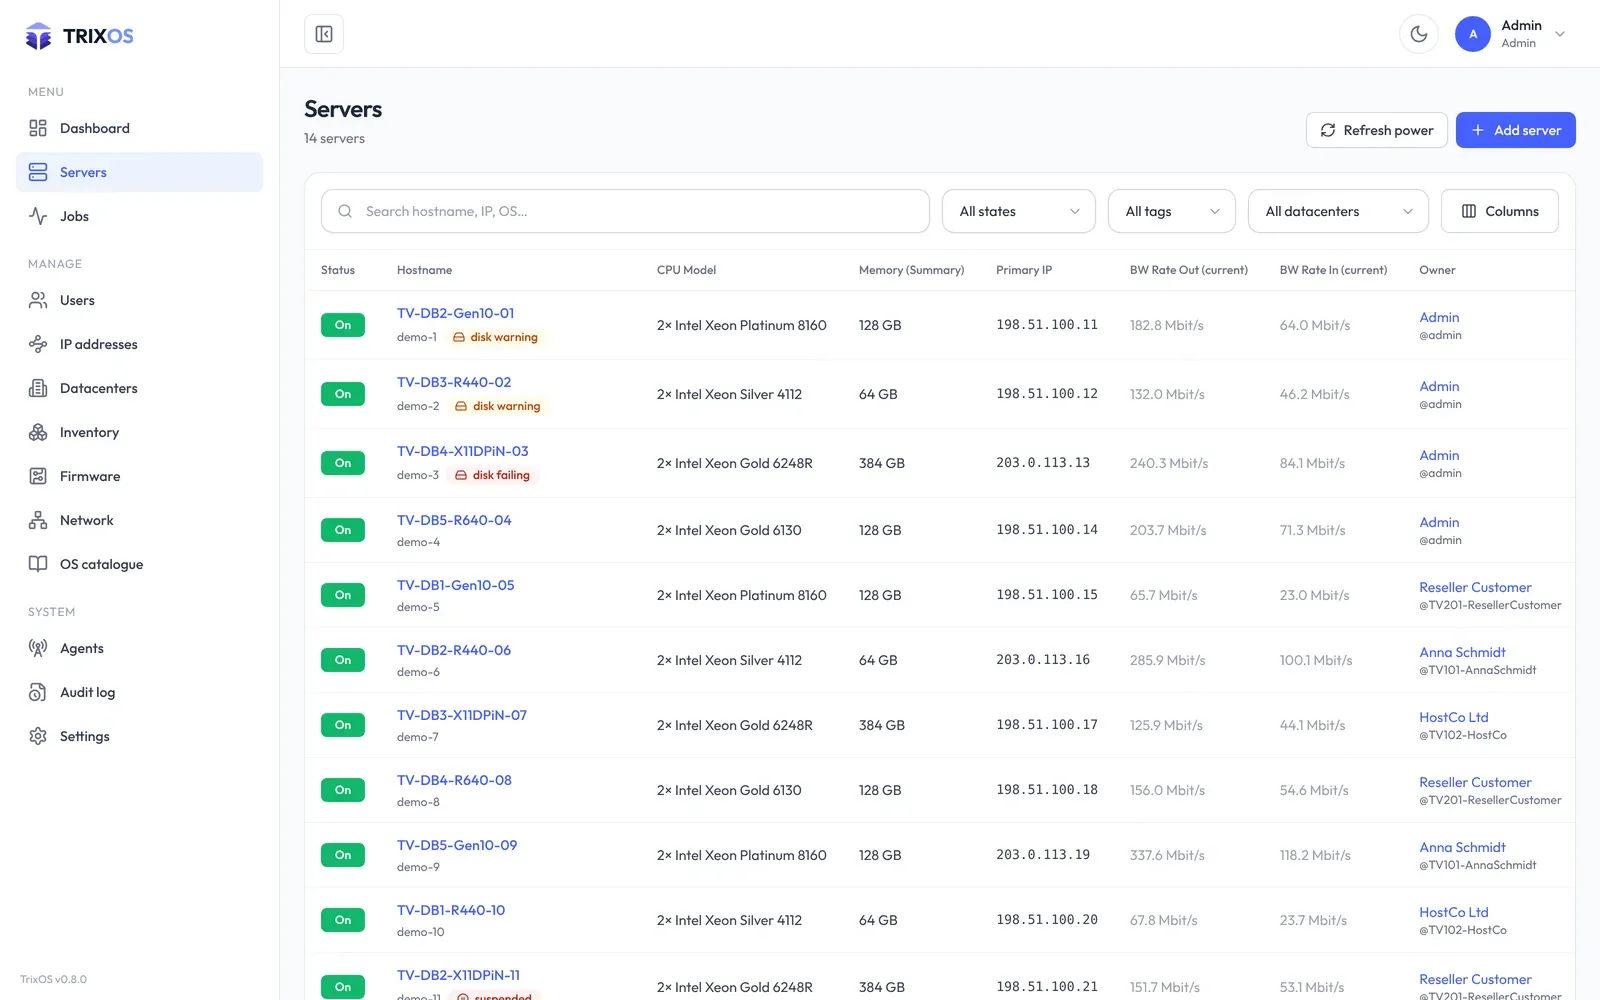
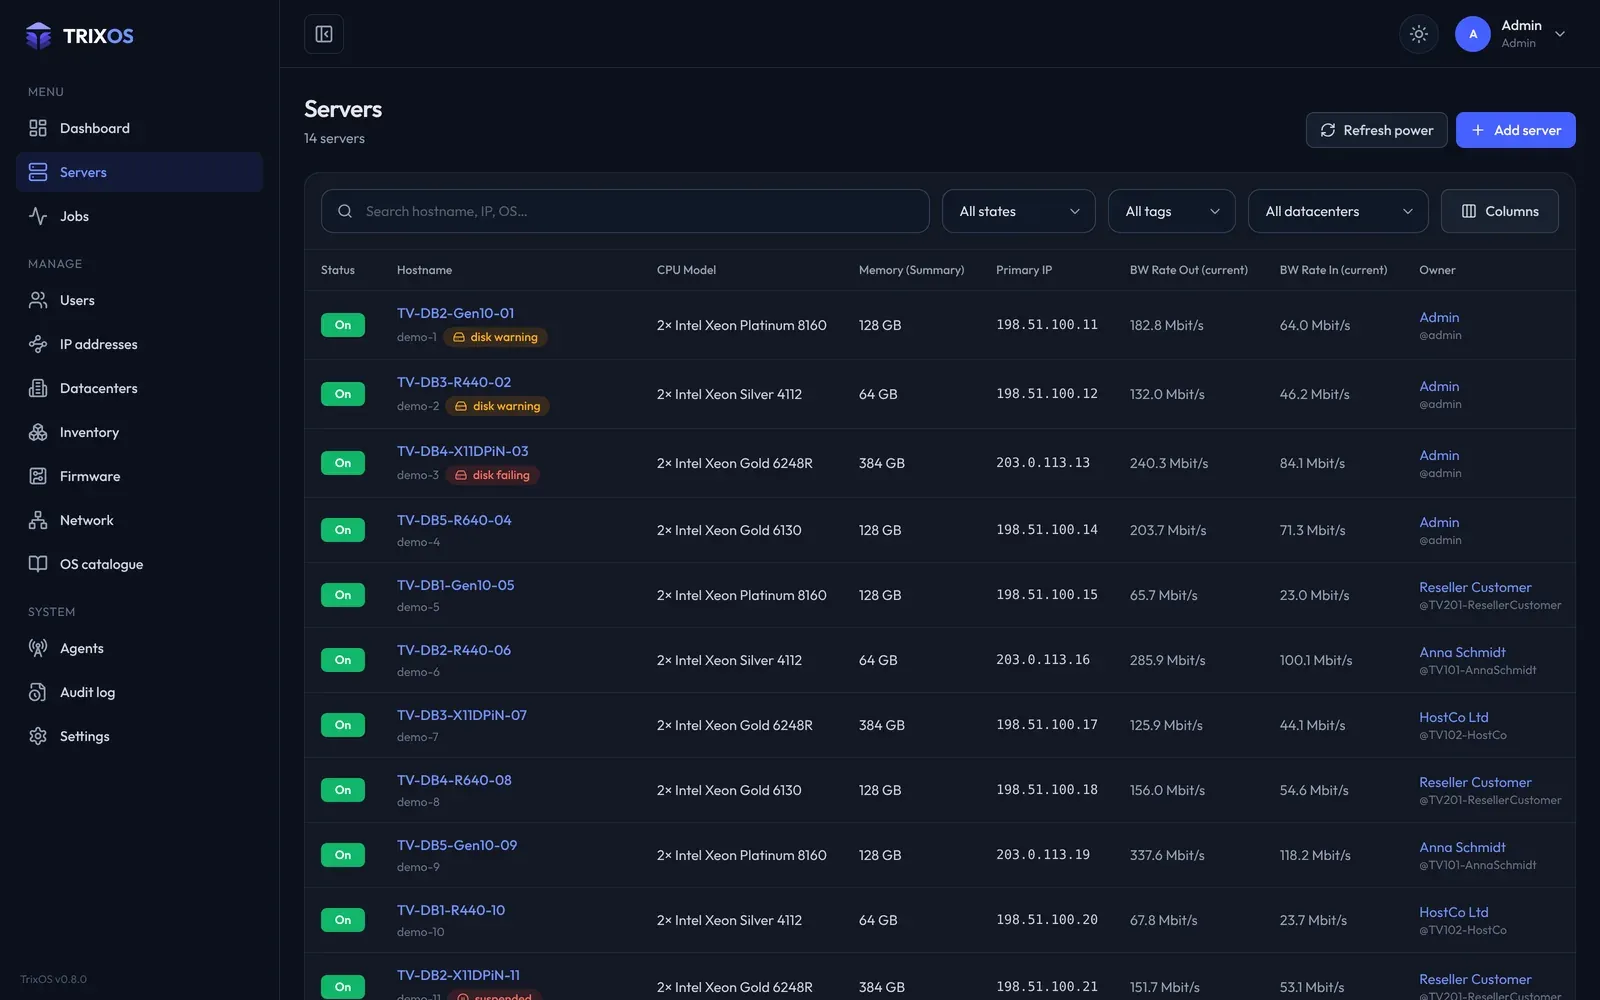
Every server in one list
Power state, hardware, primary IP, bandwidth and disk health. Pick the columns you need, filter by state, tag or datacenter. Servers and BMC
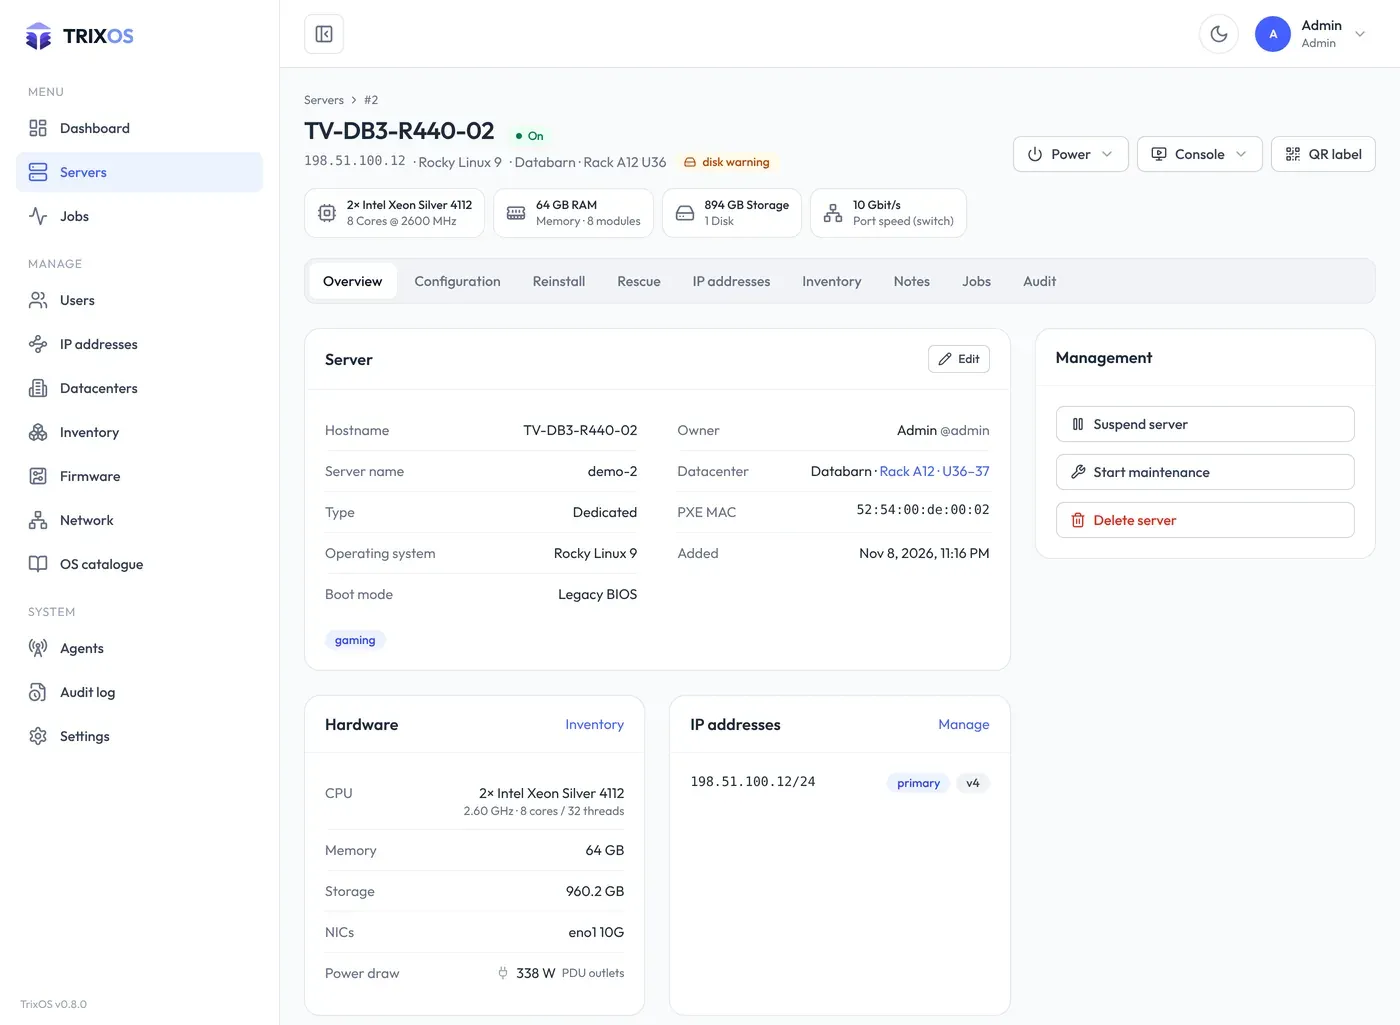
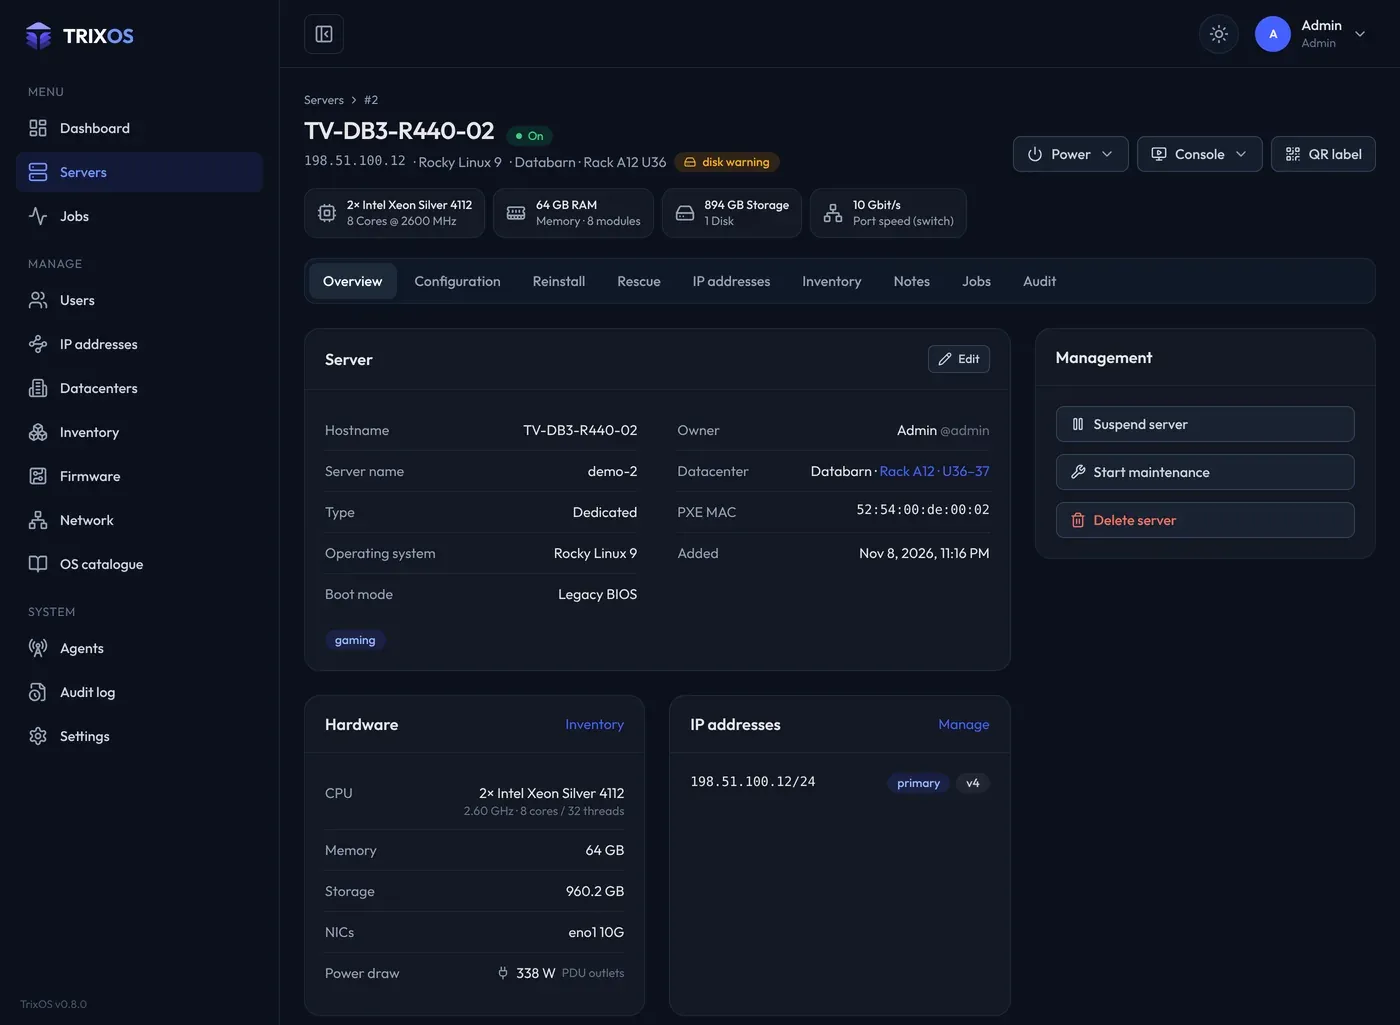
Power, console and jobs of one server
Power on, cycle or reset, open the console in the browser and follow every job of the server with its log. Servers and BMC
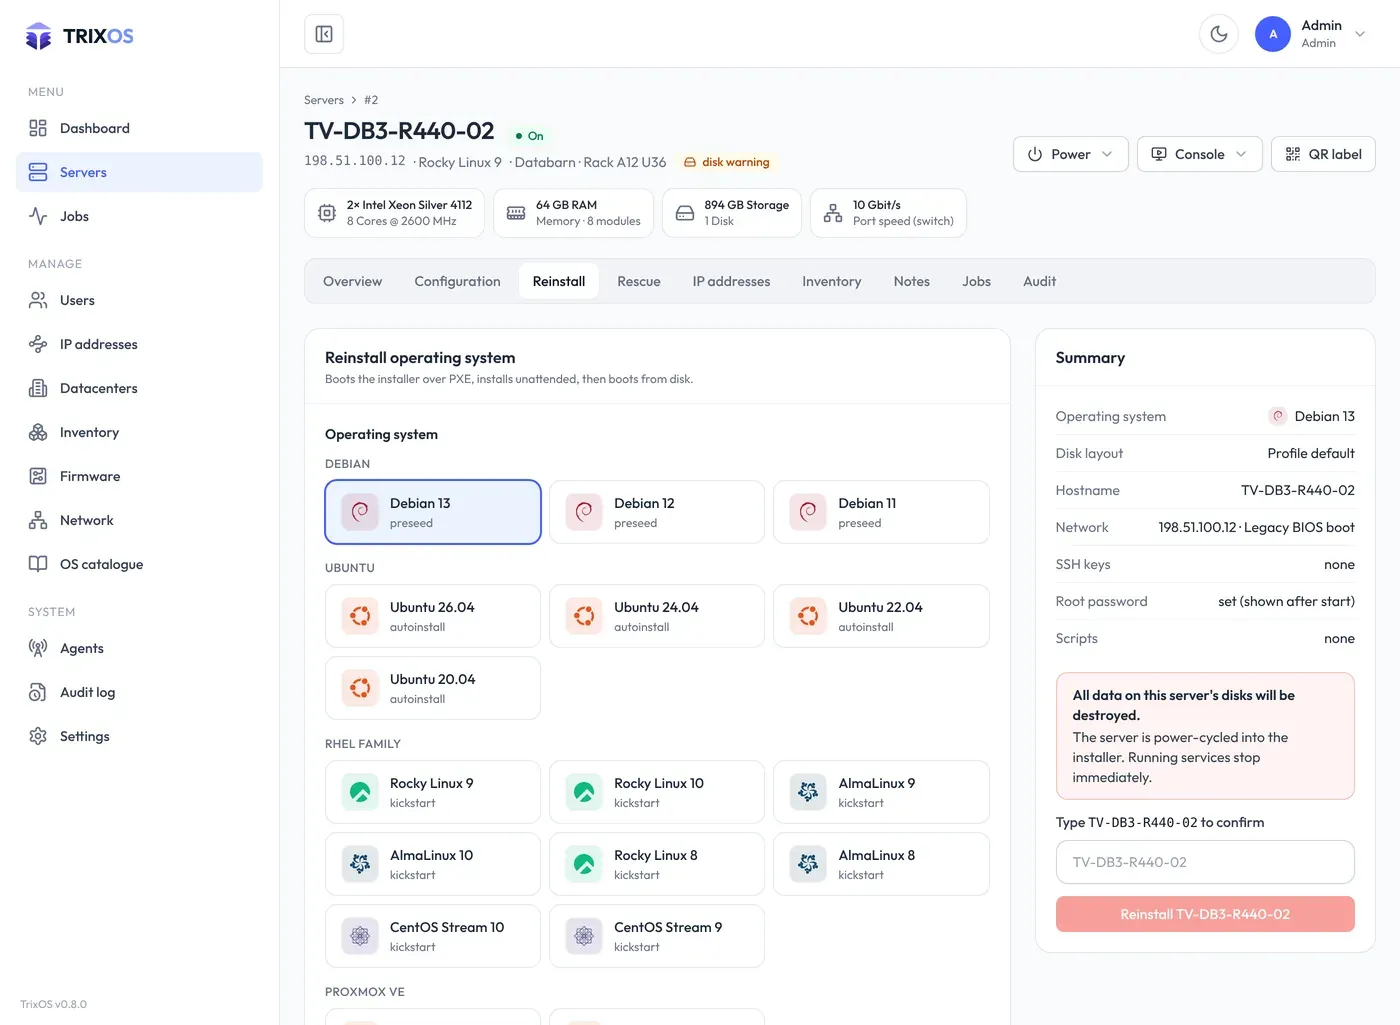
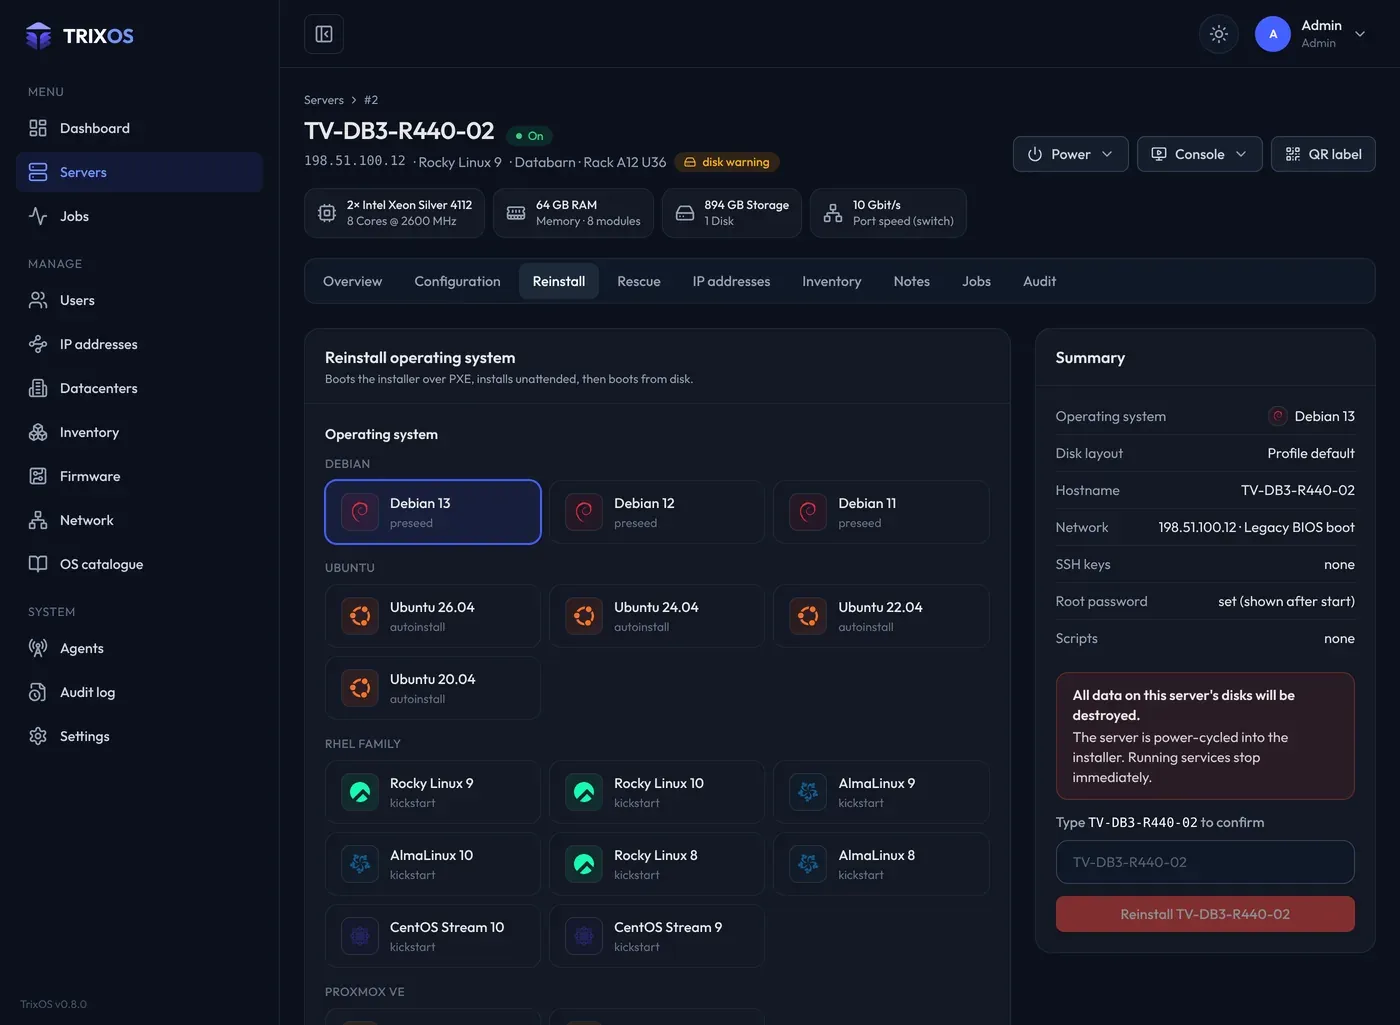
Reinstall and rescue over PXE
Debian, Ubuntu, Rocky, Alma, Proxmox VE and Windows, rescue systems and your own ISOs. Legacy BIOS or UEFI, detected for you. OS installs and rescue
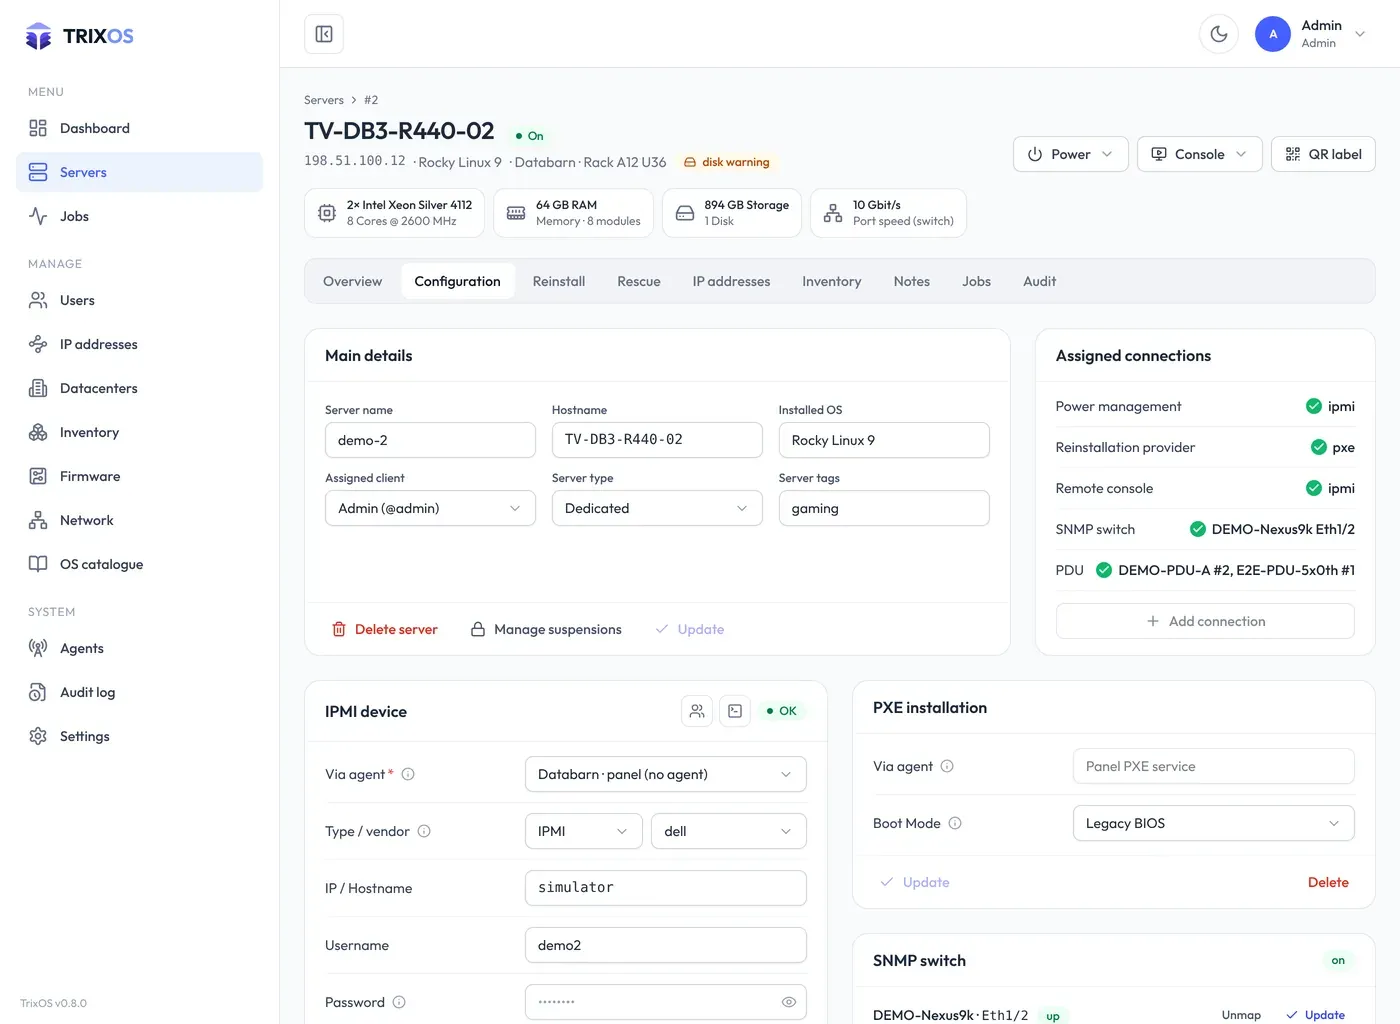
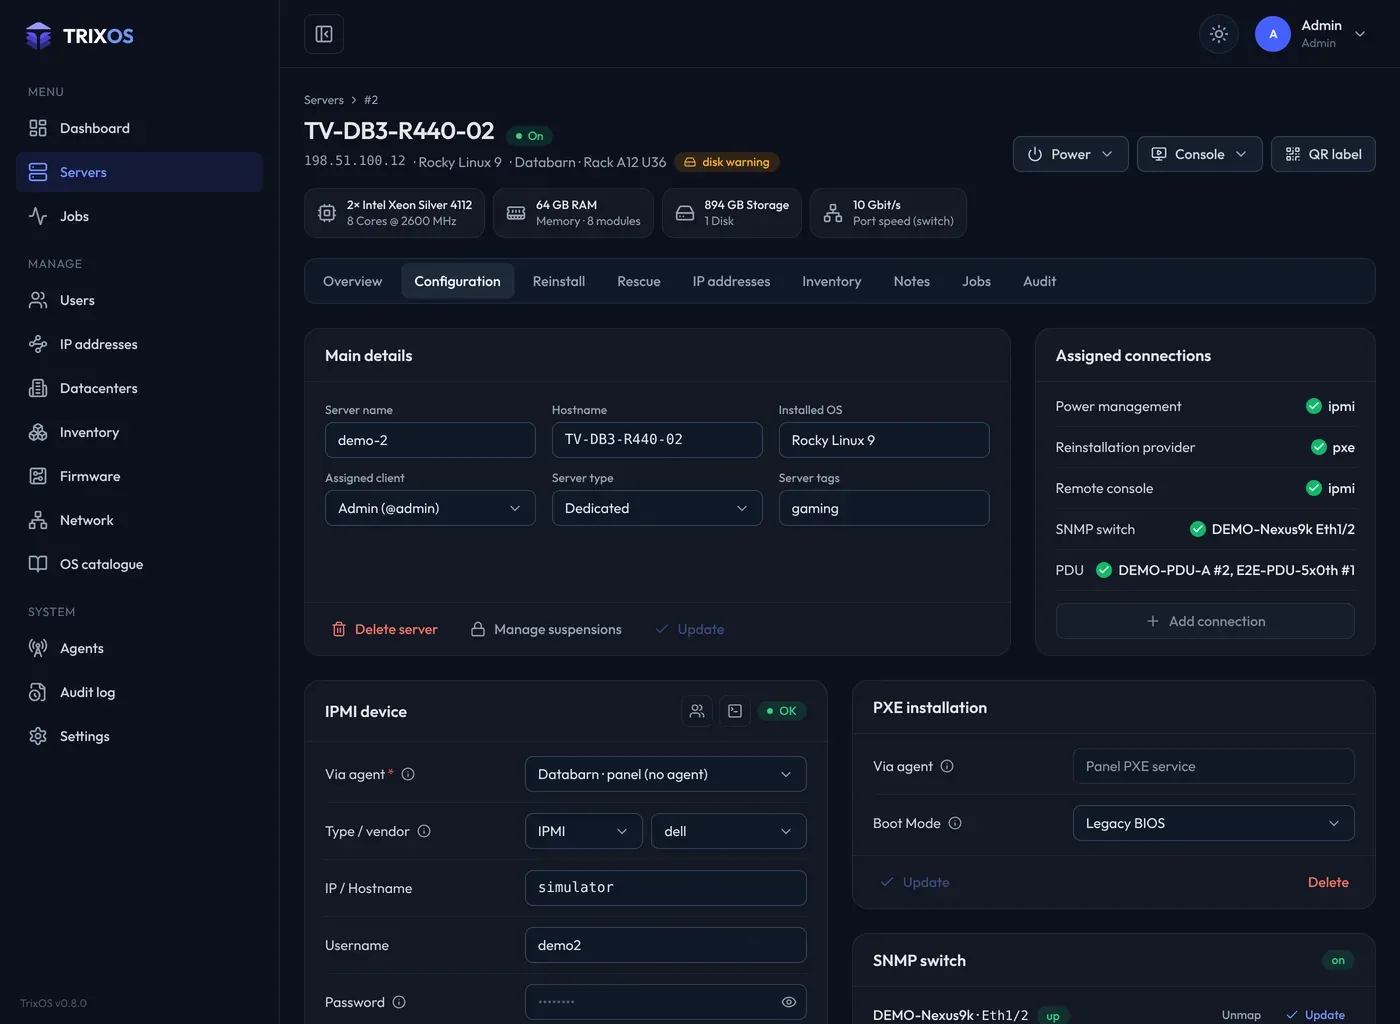
Every setting of a server on one tab
BMC, DHCP and PXE, the switch port and how the server gets its power: the BMC, PDU outlets or PoE. Server configuration
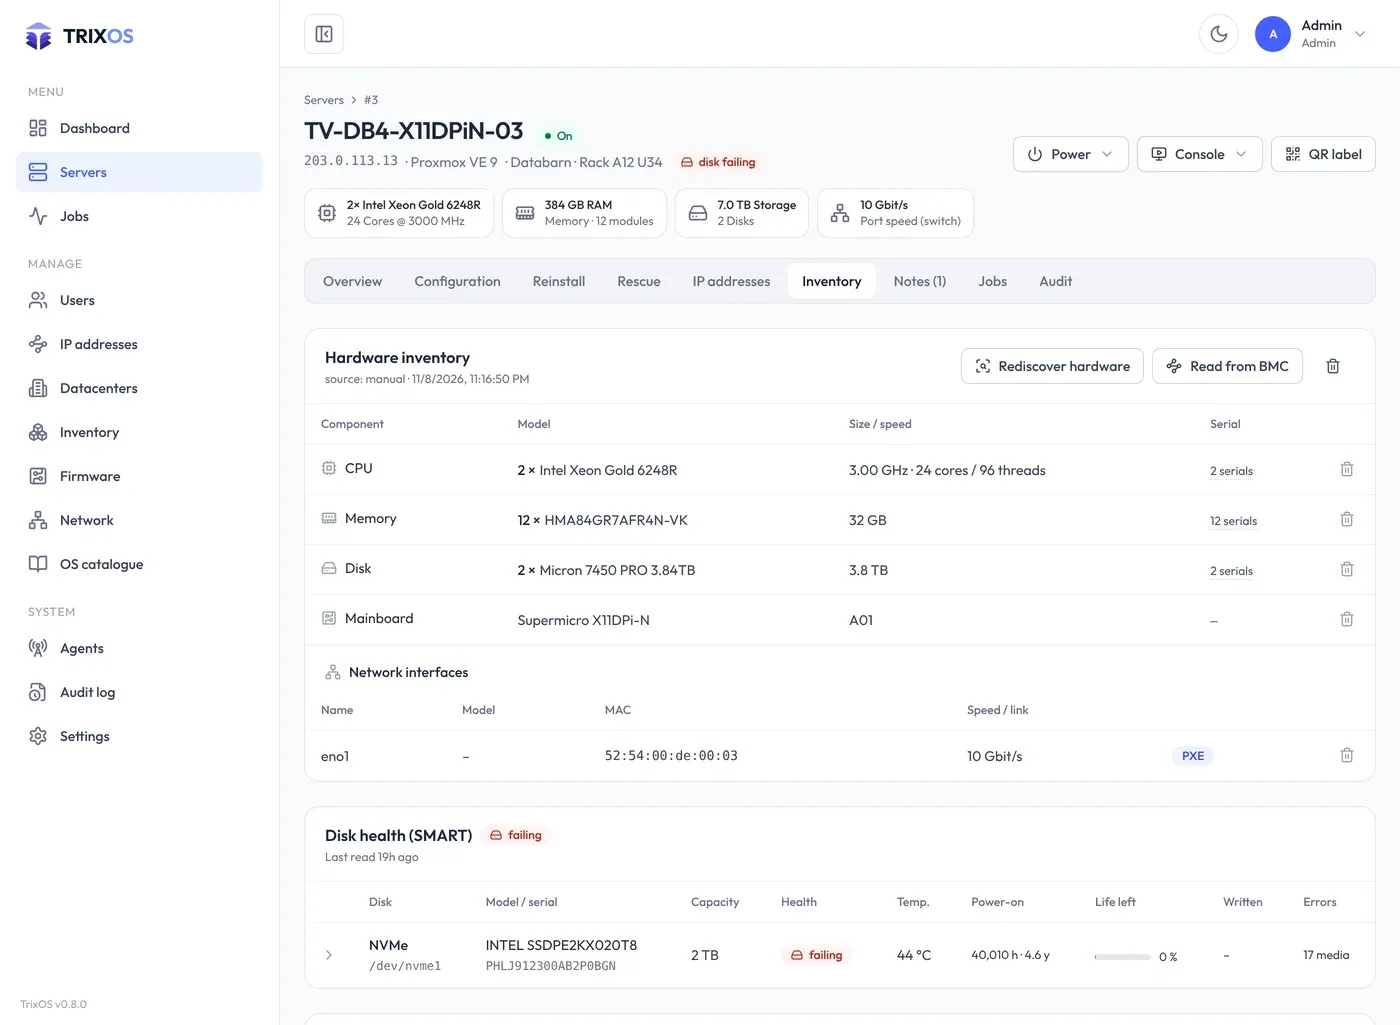
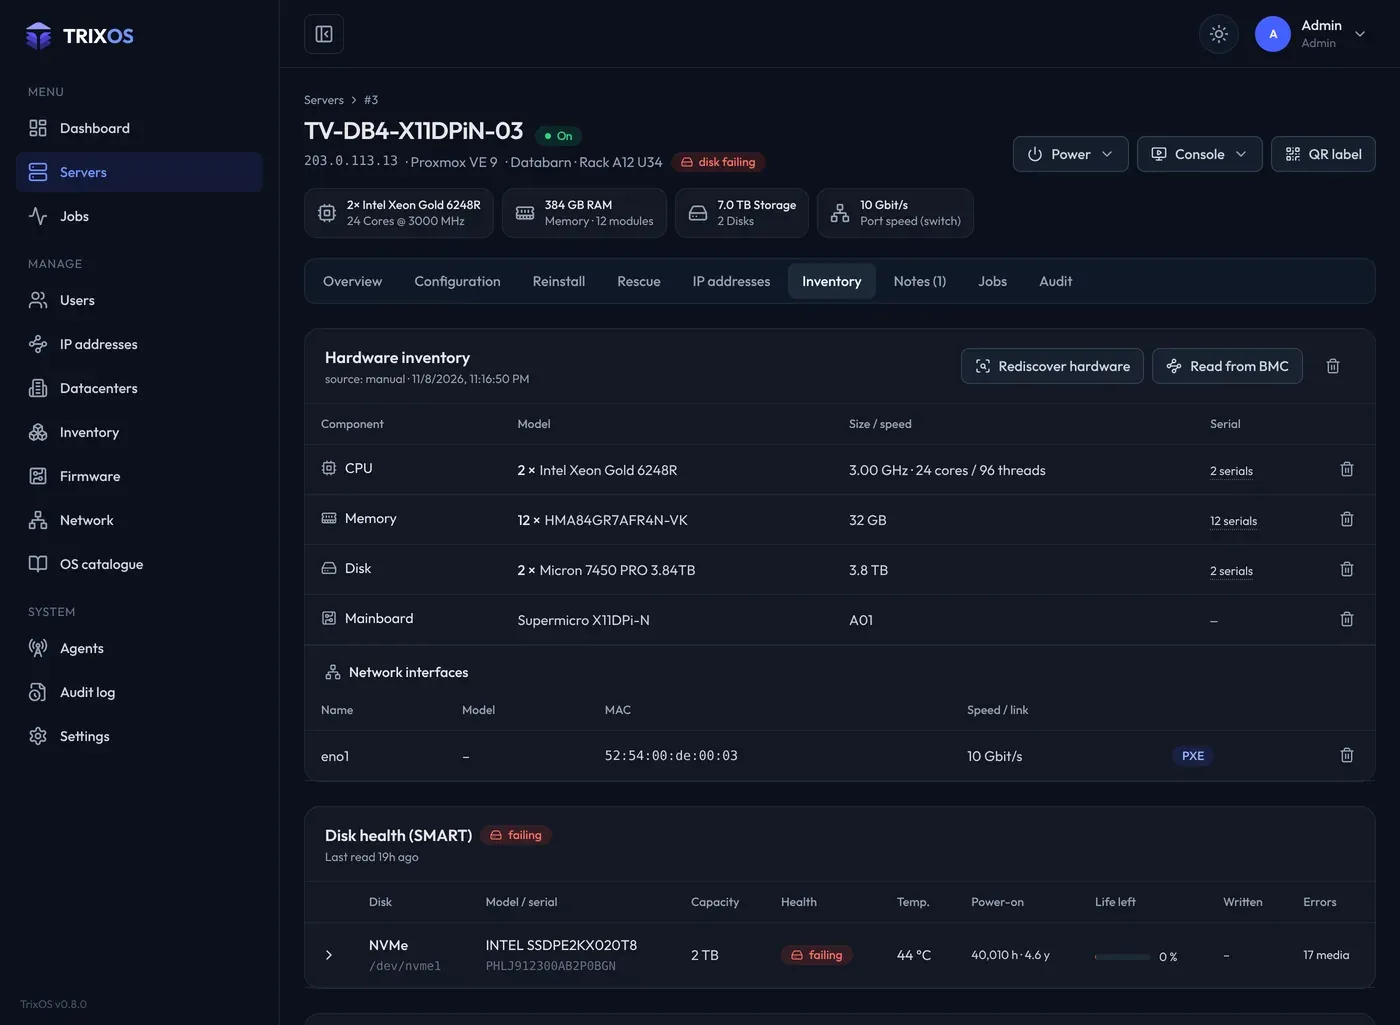
Hardware down to the RAID controller
CPUs, memory, controllers, disks behind Smart Array and MegaRAID, NICs and power supplies, with SMART for every disk. Hardware inventory
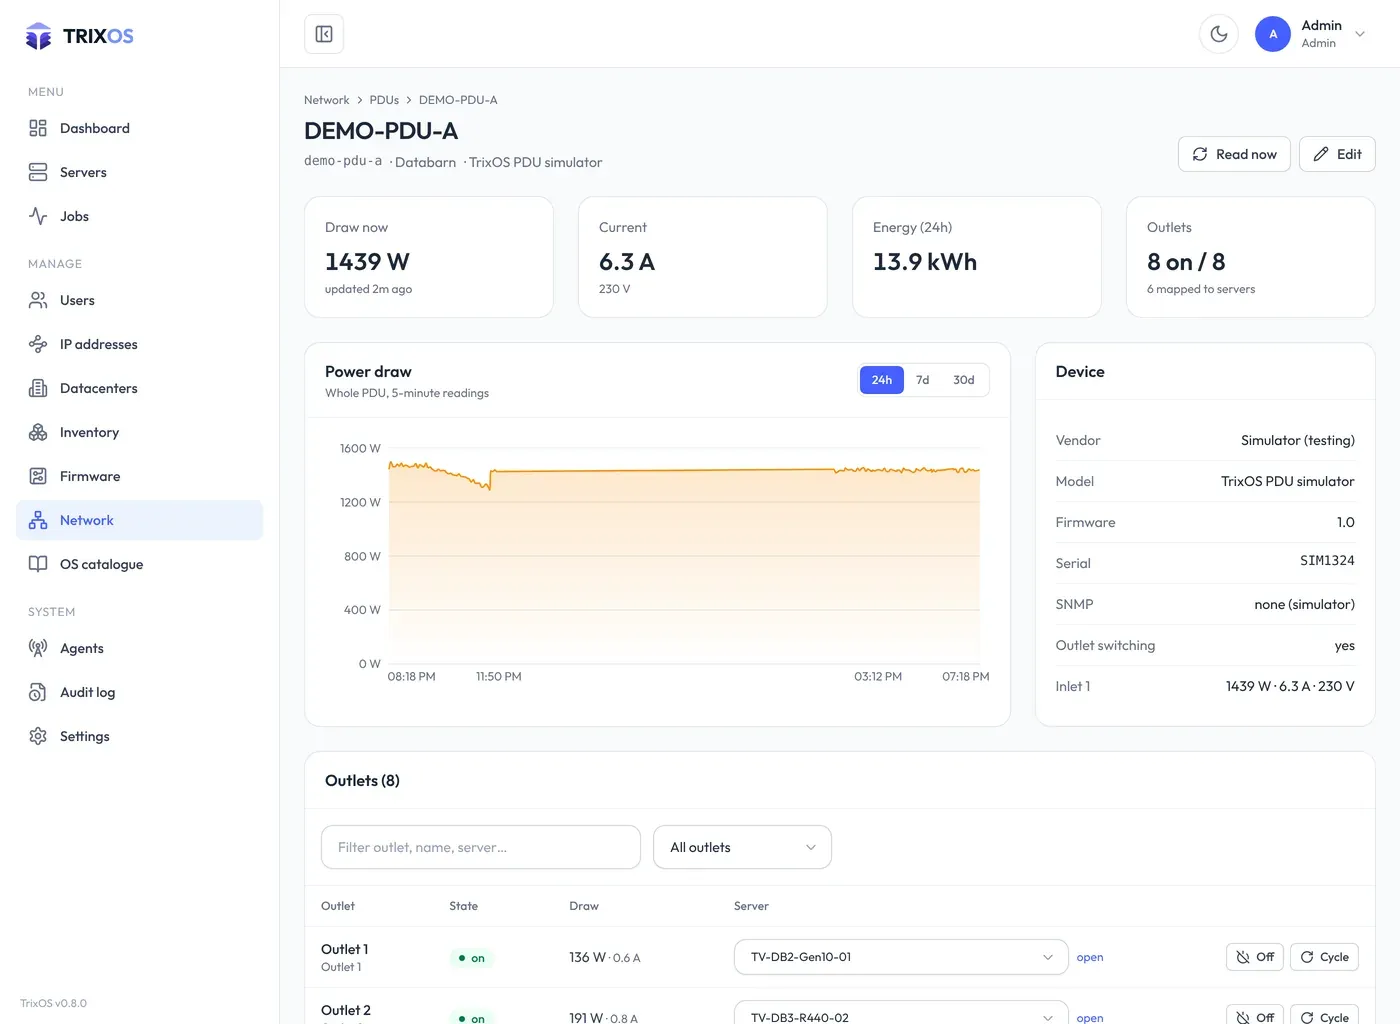
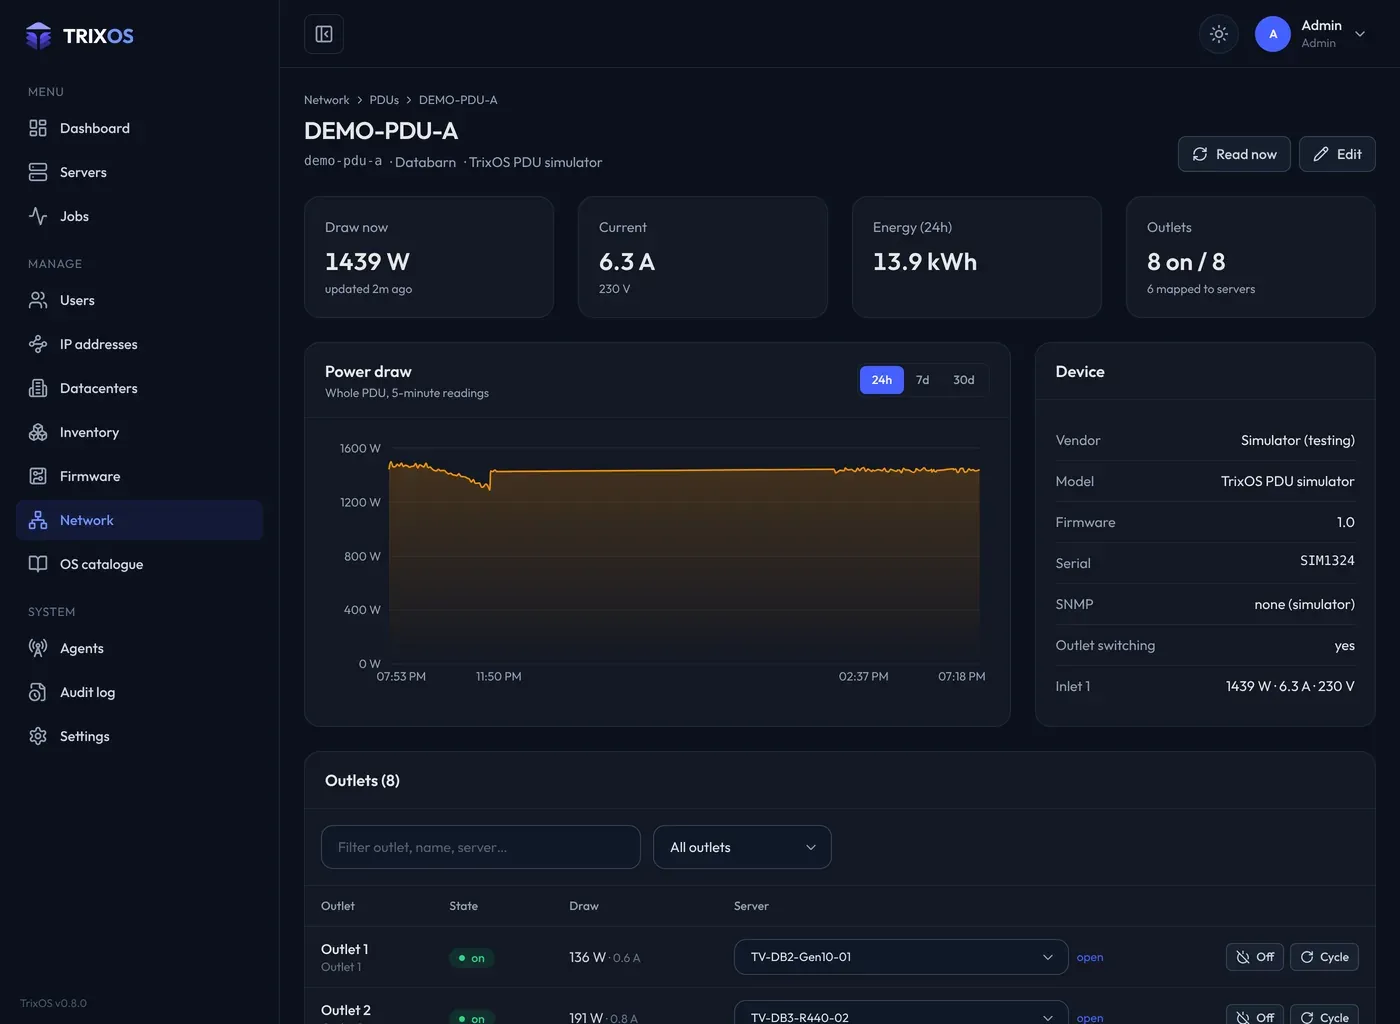
Power usage per server, in kWh
APC and Raritan PDUs over SNMP every five minutes. Outlets mapped to servers, switched as logged jobs. PDUs and power usage
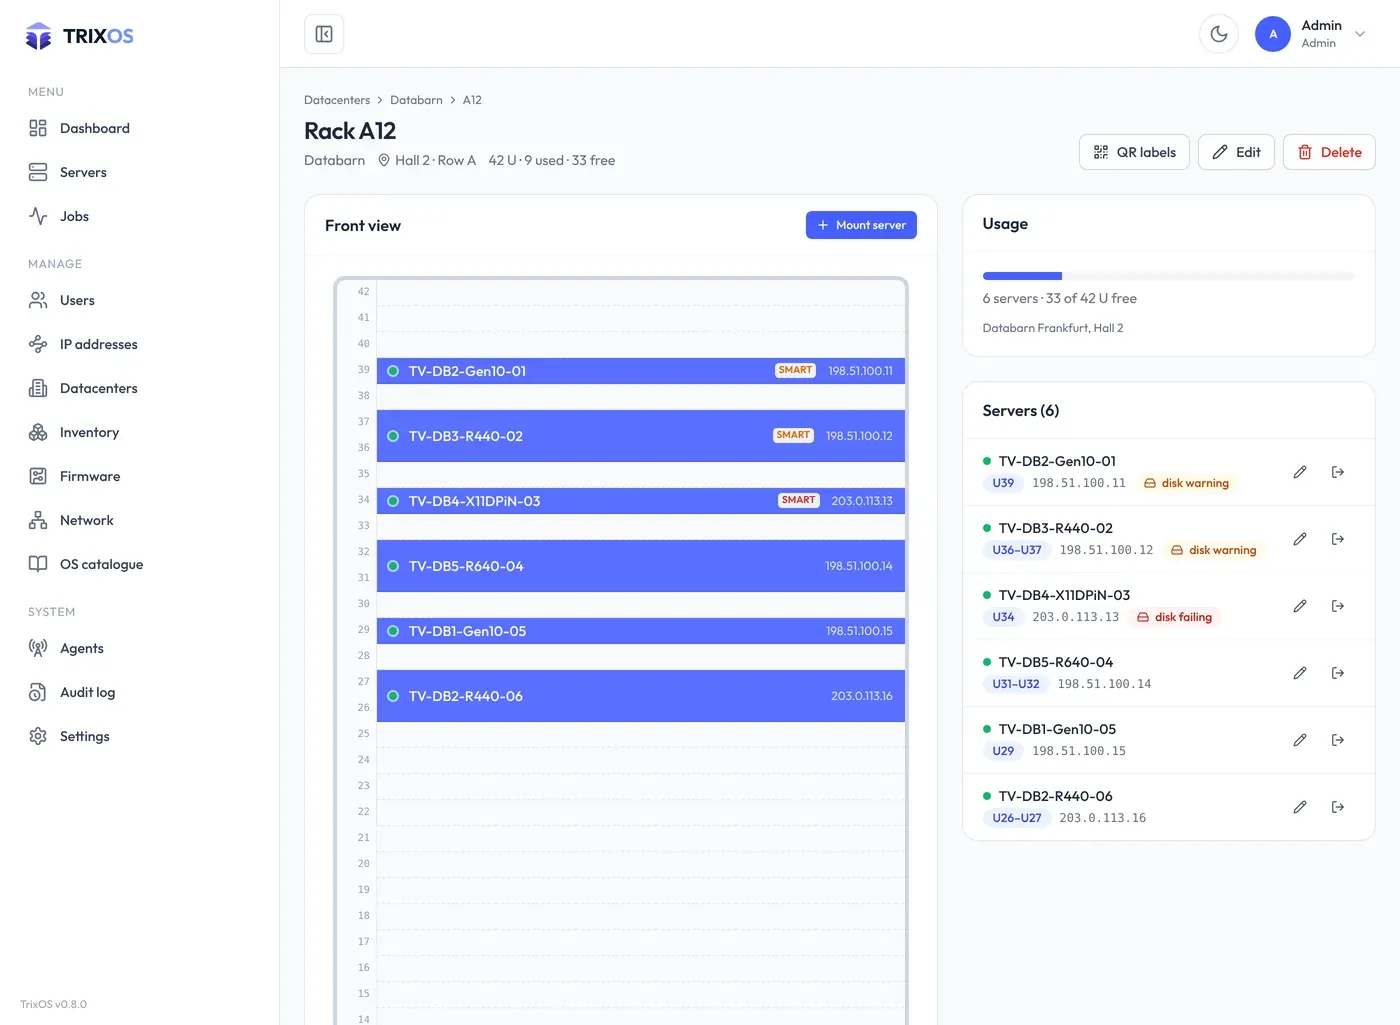
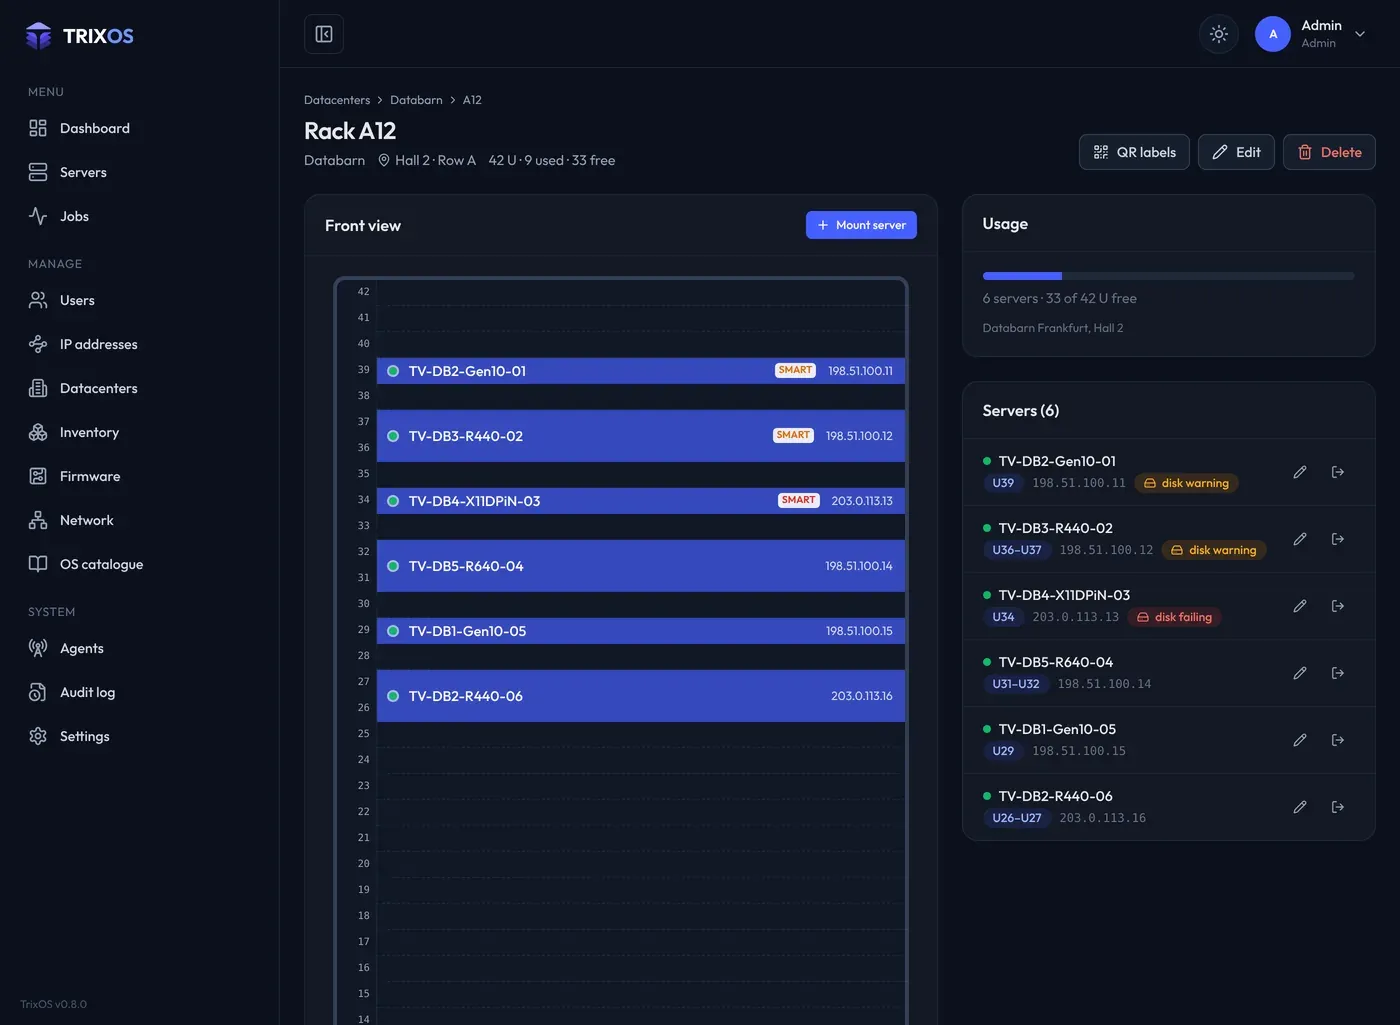
Racks the way they look
Front view with every mounted server, its power state and disk health. Labels with a QR code that opens the server. Datacenters, racks and labels
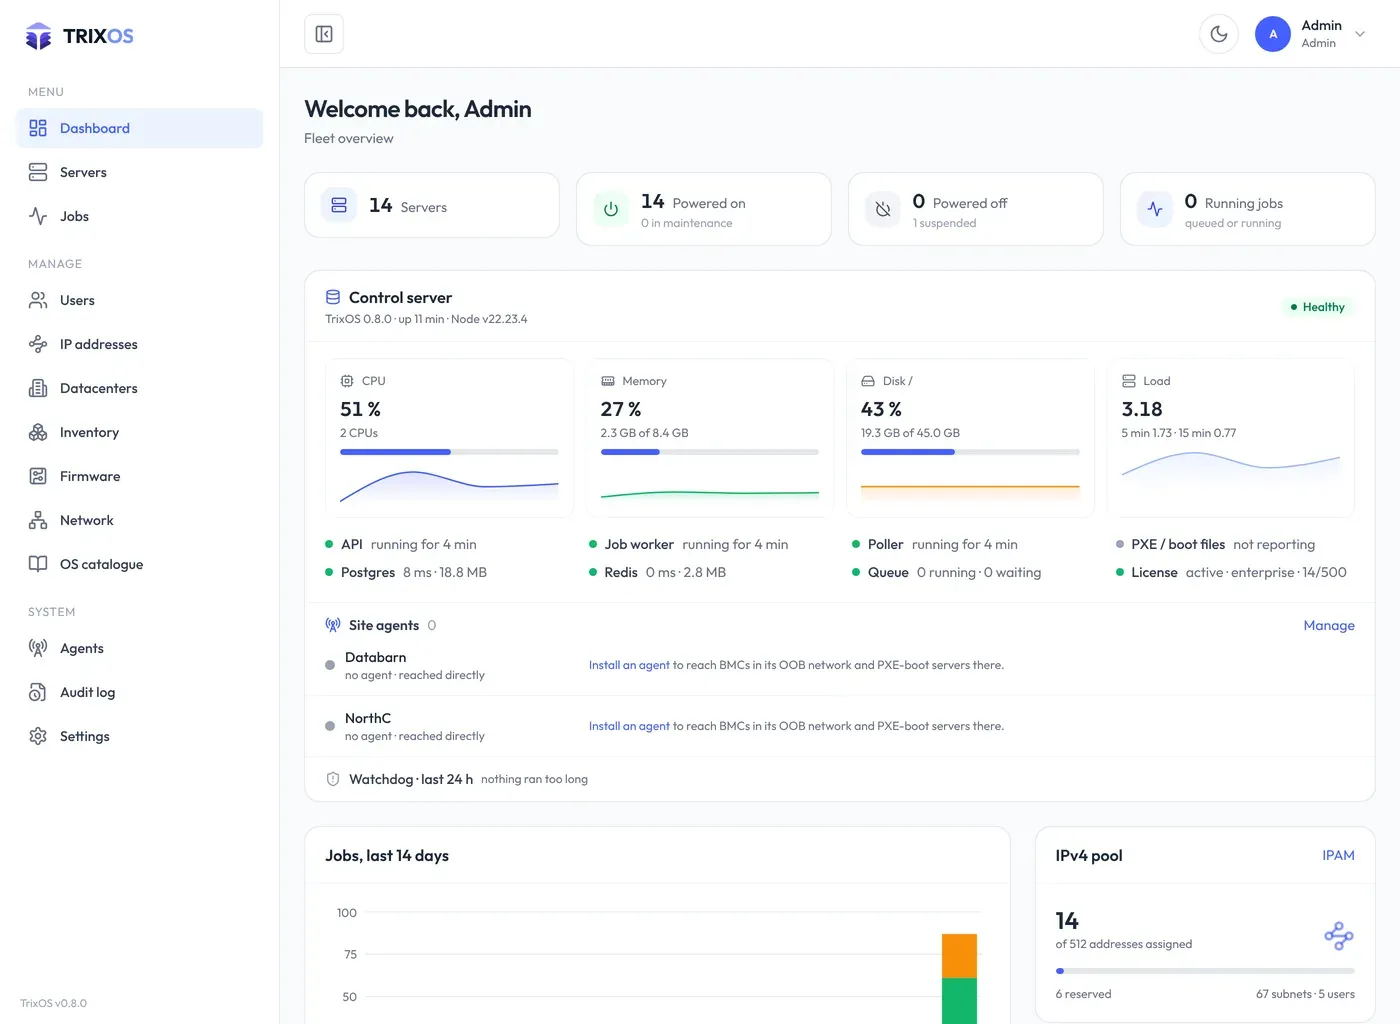
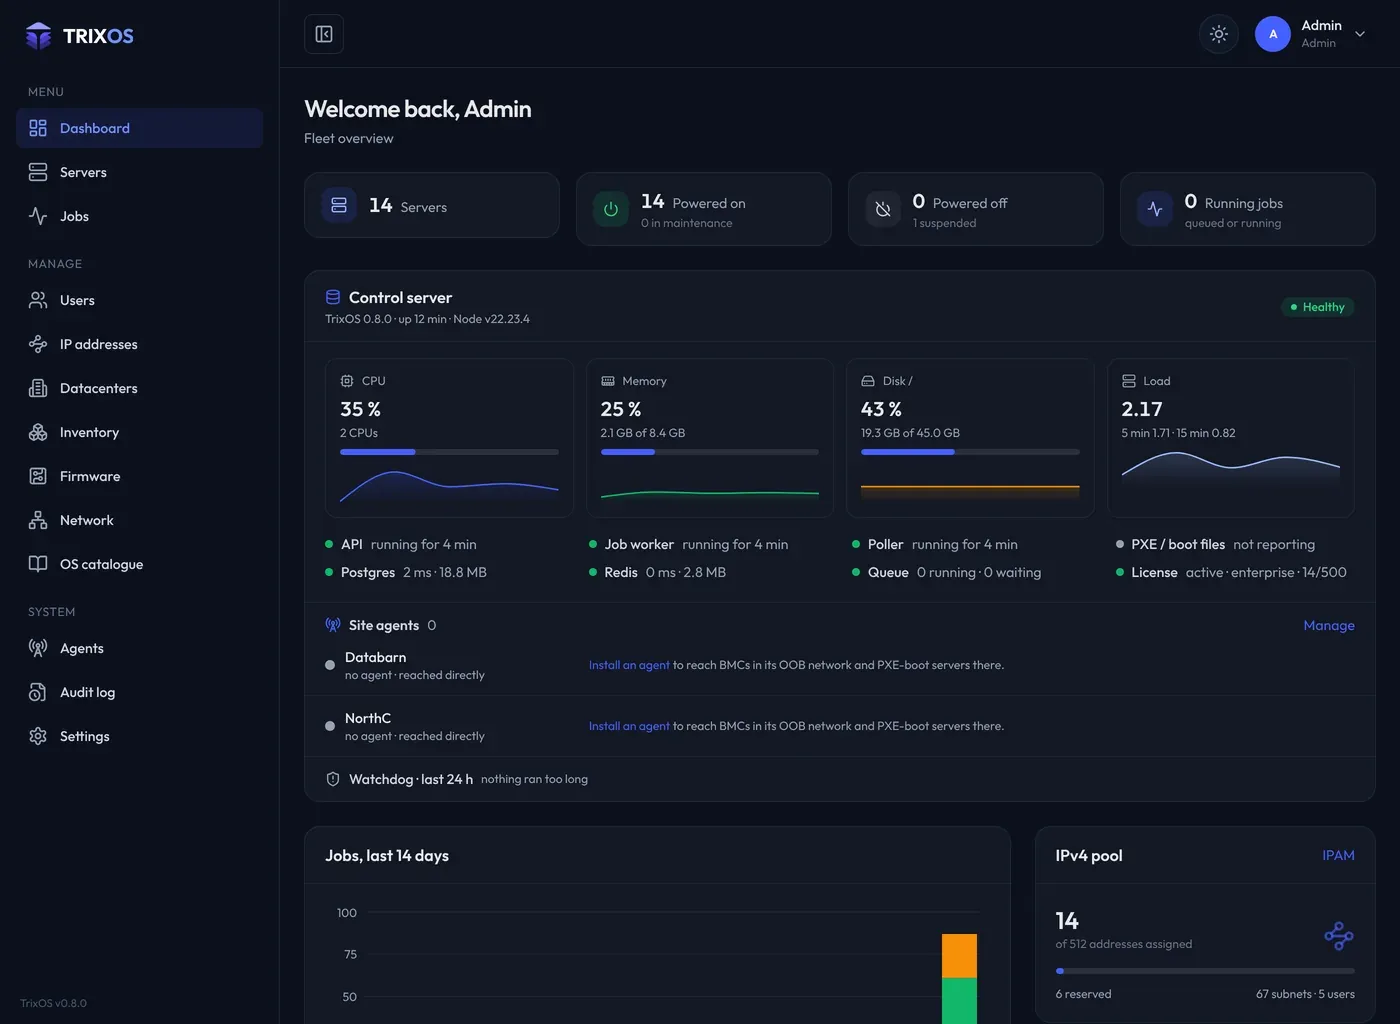
The panel watches itself
CPU, memory, disk and load of the control server and every site agent, the services and the job queue. System health